
Hiring and retaining great talent has become one of the hardest and most expensive challenges for organizations today. Resumes and degrees tell you what someone has done, but not necessarily what they can do. That’s why skills-based hiring is critical: it identifies candidates on the basis of ability, not proxies.
Eightfold Match Score provides a quantitative signal of skills alignment. In this blog, we analyze promotion and retention outcomes for employees hired with different Match Score ranges. Using retention analysis and promotion-rate tracking across organizations and industries, we find consistent evidence that higher Match Scores predict significant long-term outcomes.
Methods:
Our analysis used aggregated, anonymized hiring and career progression data across multiple organizations. We compared outcomes for employees with high Match Scores (≥4.0) against those with lower scores. Key measures included:
- Promotions: cumulative promotions per capita by hire date. The study consists of approximately 688k employees covering the years 2021-2025.
- Retention: survival rates and Kaplan-Meier curves to capture attrition risk over time, by hire date. The study consists of approximately 377k employees covering the years 2023-2024, and undersampling the retail industry.
- Retail Industry Segmentation: high-churn sectors such as retail. The study consists of approximately 209k employees covering the years 2023-2024.
Results:
- Hire the Strongest Talent: High Match Score hires (≥4.0) are promoted at higher rates. Within 2 years of hire, the high Match Score group experienced nearly 50% more promotions (per capita) than the low-match group. In other words, skills-based hiring using Eightfold’s Match Score yields significantly higher performing talent.
- Higher Retention: Candidates identified as strong matches (Eightfold Match Score ≥4.0) had an overall 12-month retention rate of ~78%, higher than the 73% retention rate for lower-score hires. This ~5% gap yields a large turnover cost-savings for any organization adopting Eightfold’s Match Score. The effect is even more pronounced for mass-hiring organizations such as those in the retail industry: a 12.5% increase in 12-month retention in high Match Score hires.
- Turnover Cost Savings: Even modest improvements in retention translate into major savings. Using Match Scores to prioritize high-fit candidates could improve overall retention by ~1%, which for a 10,000-employee company would avoid an estimated $5 million in annual turnover costs. For a smaller 2,000-employee company, the savings would be $1 million in annual costs saved.
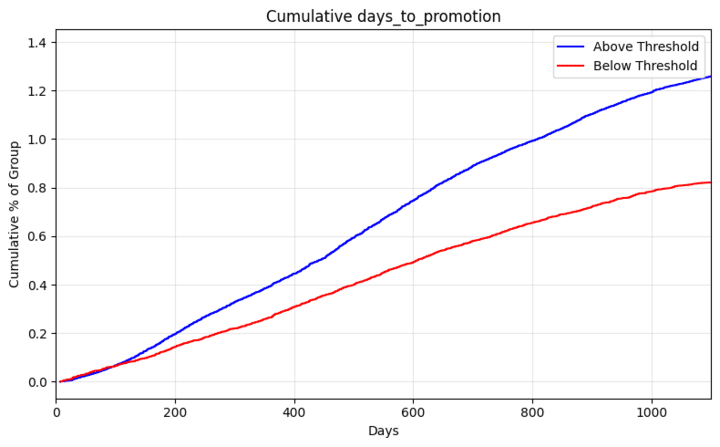
Promotions and career growth distribution (All organizations)
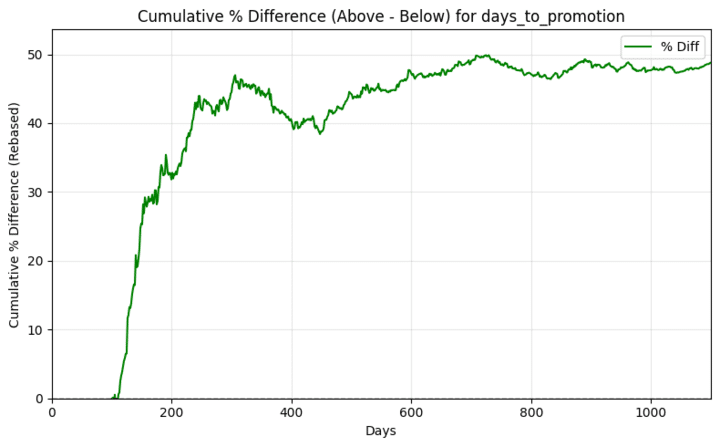
High Match Score hires (≥4.0) are promoted at higher rates. Within two years of hire, the high Match Score group experienced nearly 50% more promotions (per capita) than the low-match group. Promotions are one of the strongest and most direct indicators of internal employee performance.
Cumulative promotions over time by Match Score group
Promotion rate difference (high vs. low Match Score groups)
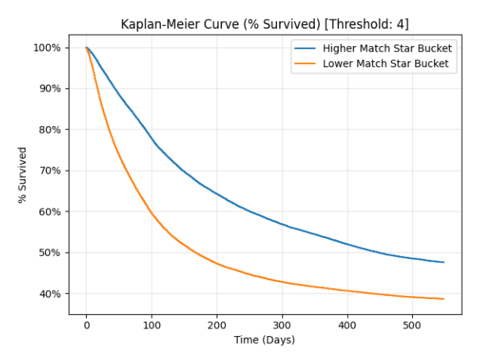
Retention outcomes (All organizations)
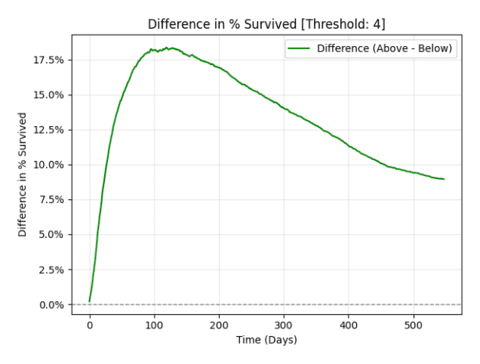
Candidates with strong matches (Match Score ≥4.0) had an overall 12-month retention rate of ~78%, compared to 73% for lower-score hires. This ~5% gap yields meaningful turnover savings.
Kaplan–Meier retention curves by Match Score group
Retention rate difference over time (high vs. low Match Score hires)
Industry case: Retail
In retail, a high-churn sector, retention improvements are even more pronounced. At ~120 days, the retention gap reached ~18% (72% vs. 54%).
Kaplan–Meier retention in retail hires by Match Score group
Retention rate difference over time in retail hires
These findings demonstrate that Match Score is a robust predictor of both retention and promotion outcomes.
Key observations:
- The correlation between Match Score and career growth appears consistent across organizations.
- The early divergence in retention curves indicates that skills alignment predicts not only long-term engagement but also short-term success in role fit.
- The effect is generalizable across industries, and is stronger in higher-turnover industries such as retail.
Limitations
This analysis measures relative outcomes within Eightfold’s dataset. While effects are strong and consistent, outcomes may vary depending on organization size, industry, and implementation of skills-based hiring practices.
Conclusion and implications
Our analysis shows that Match Score provides a measurable and reliable signal for hiring outcomes. Employees hired with higher Match Scores are more likely to stay longer, advance faster, and contribute greater value to their organizations.
For technical practitioners, these results validate the use of skills-based models and survival analysis in predicting workforce outcomes. Organizations underscore the importance of adopting data-driven approaches to hiring.
Be part of the future of AI and talent. Explore careers with us.